
Switching to e-bikes isn’t just eco-friendly; it’s a direct lever to boost delivery velocity by over 50% and slash operational costs.
- E-bikes complete urban deliveries significantly faster than vans by bypassing traffic congestion and parking delays.
- Choosing the right battery chemistry (LFP) can triple the asset’s lifespan, drastically reducing long-term replacement costs.
Recommendation: Stop analyzing purchase price. Start calculating your fleet’s ROI based on deliveries per hour and total cost of ownership.
For any fleet manager in a congested city, the scene is painfully familiar: a delivery van sits motionless in traffic, the clock ticking on service-level agreements as the “last mile” becomes the most expensive mile. The pressure to find a more efficient, cost-effective solution is immense. While the conversation often turns to electric bike fleets, it typically gets stuck on superficial benefits like being “green” or having a lower sticker price. These points are true, but they barely scratch the surface of the real business case.
The standard analysis misses the point. The true return on investment isn’t found in simple fuel savings; it’s buried in the operational calculus of running the fleet. A successful transition from vans to e-bikes requires a strategic overhaul of your logistics mindset. It demands a granular focus on metrics that truly matter: delivery velocity, asset lifecycle cost, charging infrastructure safety, and preempting the inevitable value erosion of your existing gas-powered assets. This isn’t just about swapping vehicles; it’s about re-engineering your urban delivery model for maximum efficiency and profitability.
This guide moves beyond the generic claims to provide a framework for that exact calculation. We will dissect the key performance indicators and operational considerations you need to build a rock-solid ROI model for an e-bike fleet. From quantifiable speed advantages in dense downtown cores to the critical long-term impact of battery chemistry, you’ll gain the insights needed to make a data-driven decision.
Summary: The Complete ROI Breakdown for E-Bike Fleet Adoption
- Why an E-Bike Delivers Packages 30% Faster Than a Van in Downtown?
- How to Charge a Commercial Fleet of E-Bikes Without Fire Risks?
- Cargo Bike vs. Electric Moped: Which Carries More Volume per Dollar?
- The GPS Tracking Mistake That Lets Thieves Disable Your Recovery System
- When to Sell Your Gas Vans Before Low-Emission Zones Kill Their Resale Value?
- How to Navigate European Train Systems Like a Local for Stress-Free Transits?
- LFP vs. NMC: Which Lithium Chemistry Lasts Longer in Hot Garages?
- Solar Battery Storage vs. Grid Tie: Which Calculation Makes Sense for Suburban Homes?
Why an E-Bike Delivers Packages 30% Faster Than a Van in Downtown?
The single most impactful metric in urban logistics is not top speed, but delivery velocity—the total time it takes to complete a delivery cycle. In this area, the e-bike’s advantage is overwhelming. While vans are paralyzed by traffic, one-way systems, and the endless search for parking, e-bikes leverage a parallel infrastructure of bike lanes, shortcuts, and direct-to-door access. This allows them to maintain a consistent, predictable pace that vans simply cannot match in a dense urban environment.
The data from real-world studies is conclusive. A Brussels last-mile delivery study found that cargo bikes could achieve 10.1 deliveries per hour, more than double the 4.9 deliveries managed by traditional vans. Similarly, a study in London revealed that cargo bikes deliver goods 1.61 times faster on average, all while eliminating significant carbon and nitrogen oxide emissions.
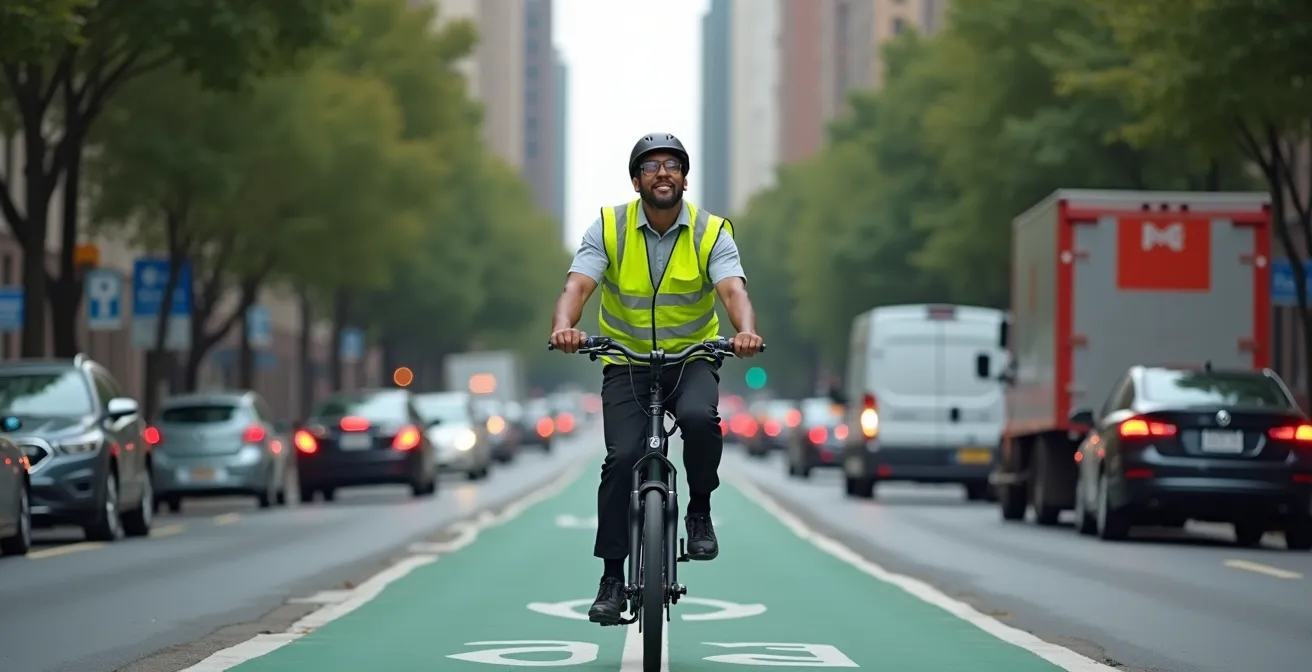
As this image illustrates, the e-bike courier isn’t just moving faster; they are operating in a different, more efficient system. While the van is a liability in congestion, the bike is an asset. This speed differential translates directly to the bottom line: more deliveries per rider, per hour, means higher revenue, better customer satisfaction, and a more scalable operational model. The question for a fleet manager isn’t whether e-bikes are faster, but how to reconfigure routes and schedules to maximize this inherent speed advantage.
How to Charge a Commercial Fleet of E-Bikes Without Fire Risks?
Transitioning to an e-bike fleet introduces a new and critical piece of operational infrastructure: the charging station. Managing this improperly doesn’t just risk asset damage; it poses a significant fire and safety hazard that can halt operations and trigger massive liability. The thermal runaway of lithium-ion batteries is a well-documented risk, making a robust, safety-certified charging protocol a non-negotiable component of your fleet management strategy. The industry benchmark for this is the UL 2849 certification, a comprehensive safety standard for the entire e-bike electrical system.
Regulators are already making this mandatory. For instance, New York City’s mandatory safety legislation requires 100% of e-bikes sold to meet the UL 2849 standard. Adopting this standard isn’t just about compliance; it’s a fundamental step in risk mitigation that can also positively impact your insurance premiums. Building a safe charging infrastructure requires more than just buying certified bikes; it involves establishing a strict and enforceable protocol for your entire team.
Your E-Bike Fleet Charging Safety Checklist
- Source Chargers: Use only UL-approved chargers supplied by the e-bike manufacturer. Forbid the use of generic, third-party chargers or power supplies which are a primary cause of incidents.
- Charging Environment: Designate a well-ventilated, dry charging area. Ensure batteries are charged at room temperature (around 68°F or 20°C) and never in extreme heat or cold.
- Charging Process: Unplug chargers as soon as the battery is full to prevent overcharging. Do not leave batteries on chargers indefinitely overnight.
- Power Source: Plug chargers directly into wall outlets. Prohibit the use of extension cords or multi-socket power strips, as they are not rated for the sustained load and can overheat.
- Fire Suppression: Install automated fire suppression systems rated for Class D (combustible metal) fires in all charging rooms to contain any potential lithium-ion battery incidents.
Cargo Bike vs. Electric Moped: Which Carries More Volume per Dollar?
When replacing a van, a key question is how to maintain cargo capacity. The choice often comes down to a high-capacity cargo e-bike versus an electric moped. While a moped might seem faster, the metric that matters for ROI is volumetric efficiency—the cost to move a unit of volume per delivery. Here, the modern cargo e-bike’s design, combining large cargo bays with the legal and physical access of a bicycle, often creates a superior financial case.
A Total Cost of Ownership (TCO) analysis reveals the stark difference. While this data compares a cargo bike to a small van, the principles apply when evaluating it against a moped, which has higher insurance and maintenance costs than a bike. The cargo bike’s operational cost is dramatically lower. A trial by Zoomo’s CEO in London further proved this point: a four-wheel Vok cargo bike carrying a 2m³ load made a cross-town journey in just 29 minutes, while a van leaving at the same time took 49 minutes. The bike was faster *despite* its large cargo capacity, proving its operational dominance in real-world urban conditions.
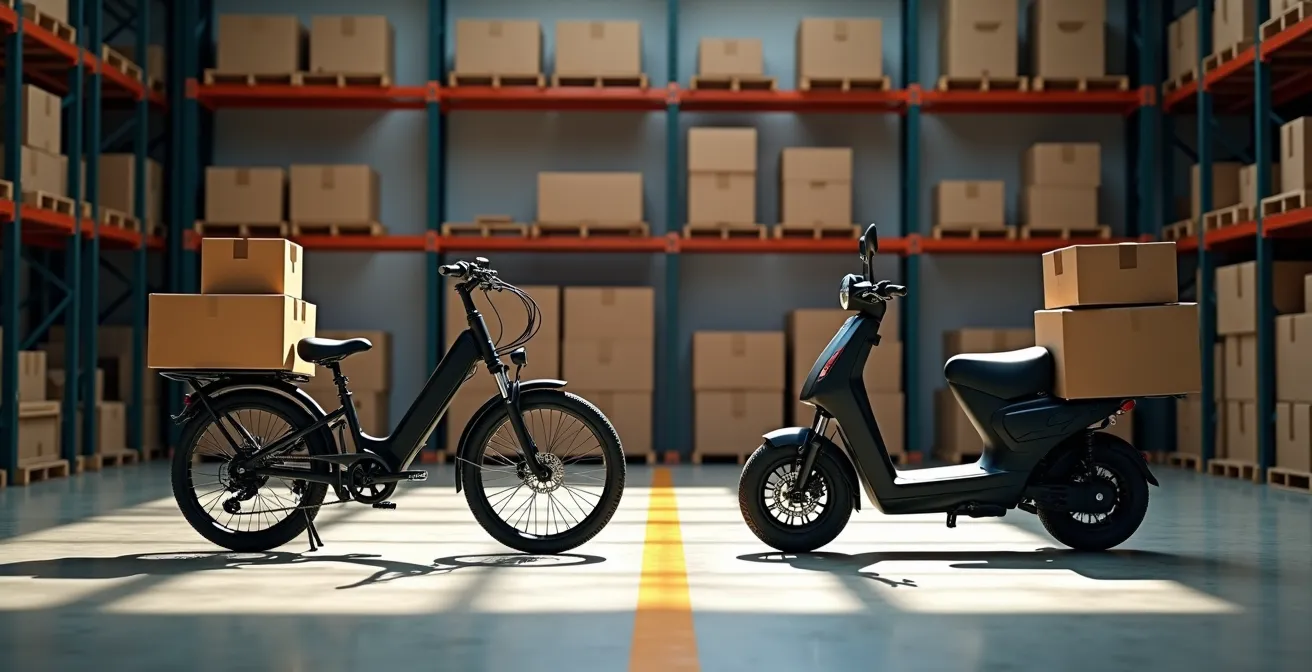
The comparison comes down to a balance of volume, speed, and cost. As shown in the data below, the cargo bike excels by drastically reducing the cost per parcel, making it a more efficient vehicle for profit generation on a per-delivery basis. This is achieved through lower energy costs, minimal maintenance, and no need for specialized licenses or insurance, unlike a moped. For a fleet manager, this means you can move more goods for less money over the asset’s lifetime.
| Metric | Cargo E-Bike | Small Petrol Van | Savings |
|---|---|---|---|
| Energy Cost per 100km | €0.50 | €12-15 | 90% |
| Delivery Cost per Parcel | €0.10 | €1.10 | 91% |
| 5-Year TCO Difference | – | – | £32,000 saved |
| Deliveries per Hour (Urban) | 10.1 | 4.9 | 106% faster |
The GPS Tracking Mistake That Lets Thieves Disable Your Recovery System
Protecting your fleet assets is paramount, and for e-bikes, GPS tracking is the first line of defense. However, the most common mistake fleet managers make is assuming any GPS tracker is sufficient. Amateur thieves know exactly what to look for: simple, externally mounted trackers or those with their own small, separate batteries. These systems are easily located, ripped off, and discarded in seconds, rendering your recovery system useless. A professional thief can disable a basic tracker in under a minute.
Effective asset protection requires a more sophisticated approach. Professional-grade fleet security is not just about a device; it’s a managed service. This involves deeply integrated trackers that are powered by the bike’s main battery, making them much harder to locate and disable without dismantling the bike itself. Furthermore, these systems are often paired with remote immobilization features, allowing your team to lock down the bike’s motor controller once it’s reported stolen, making it nothing more than a heavy, unrideable piece of metal.
Ultimately, the best defense is a proactive support network. A fleet provider with a dedicated recovery team and a widespread physical presence dramatically increases the chances of getting your asset back. For example, some dedicated e-bike fleet providers maintain a robust infrastructure of mobile technicians. Having access to a service like Zoomo’s infrastructure which includes +100 field mechanics nationwide means you have local experts who can assist law enforcement and execute a recovery. This layer of human intervention is something a simple, off-the-shelf tracker can never provide.
When to Sell Your Gas Vans Before Low-Emission Zones Kill Their Resale Value?
For fleet managers still operating diesel or petrol vans, a financial time bomb is ticking: value erosion. Cities across the globe are rapidly expanding Low-Emission Zones (LEZs) and Ultra Low-Emission Zones (ULEZs), which either ban older commercial vehicles or impose costly daily charges. Each new zone implemented or tightened drastically shrinks the secondary market for your non-compliant vans, causing their resale value to plummet. Holding onto these assets for too long means you may be left with nearly worthless metal.
The strategic move is to divest from these depreciating assets while they still have market value and reinvest the capital into a future-proof e-bike fleet. The transition is not a question of if, but when. Large-scale logistics giants are already leading the way, demonstrating the model’s viability. Deutsche Post has achieved carbon-free deliveries in about half of its German districts by deploying a massive fleet including 6,100 e-bikes and 13,500 e-trikes. This proves that replacing traditional vans with micro-mobility solutions is a scalable and operationally sound strategy.
This shift aligns with powerful market trends. The overall electric bike market is experiencing explosive growth, showing where both consumer demand and commercial investment are heading. The value of this market is not just in vehicle sales but in the entire ecosystem of rentals, leasing, and services. Timing your exit from gas vans and entry into e-bikes allows you to ride this wave of growth rather than being crushed by the obsolescence of your old fleet.
How to Navigate European Train Systems Like a Local for Stress-Free Transits?
For a business, “navigating transit systems” is not about tourism; it’s about optimizing employee and package mobility in the most efficient way possible. In many urban environments, the most effective logistics network is not one that relies on a single vehicle type, but one that creates a flexible multi-modal system. This involves strategically integrating your e-bike fleet with existing public transit like trains and subways to bypass the most congested parts of a city entirely.
Instead of forcing a van to crawl through miles of gridlock, a multi-modal approach might see a courier ride an e-bike to a local train station, take the train to a station near the final delivery zone, and then use another e-bike for the final mile. This “hub-and-spoke” model can dramatically cut transit times for both employees and packages. Implementing this requires a shift from traditional company car policies to more flexible mobility budgets.
Here are key strategies for implementing a multi-modal mobility program:
- Replace rigid company car leases with flexible mobility stipends that cover public transit passes and access to a shared e-bike fleet.
- Install “station bikes” at depots near major transit hubs, allowing employees to seamlessly switch from train to bike.
- Create a corporate pool of shared, foldable e-bikes that can be easily carried onto trains for maximum flexibility.
- Track the ROI not only through fuel and maintenance savings but also through reduced corporate parking costs and improved employee wellness metrics.
- Partner with local transit authorities to explore integrated ticketing solutions that combine train and bike-share access.
LFP vs. NMC: Which Lithium Chemistry Lasts Longer in Hot Garages?
When calculating the long-term ROI of an e-bike fleet, the single most significant factor in your asset lifecycle cost is the battery. The battery is the most expensive consumable component, and its lifespan directly impacts your TCO. Not all lithium-ion batteries are created equal. The two dominant chemistries for commercial fleets are Lithium Iron Phosphate (LFP) and Nickel Manganese Cobalt (NMC), and choosing the right one is a critical financial decision.
For most commercial fleet applications, especially those operating in varied temperatures, LFP is the superior choice for several key reasons. The most important is cycle life. LFP batteries demonstrate a lifespan of 3000-5000 charge cycles, whereas NMC batteries typically last for only 800-1500 cycles. This means an LFP-powered fleet will require significantly fewer costly battery replacements over its operational life, directly lowering your TCO.
Furthermore, LFP batteries offer far greater thermal stability. They are less prone to thermal runaway, making them inherently safer to store and charge in a commercial garage, especially in warmer climates. This enhanced safety profile can also lead to more favorable insurance premiums. While NMC batteries may offer slightly higher energy density (a lighter battery for the same range), for a commercial operator, the longevity and safety of LFP present a much stronger business case.
| Factor | LFP (Lithium Iron Phosphate) | NMC (Nickel Manganese Cobalt) |
|---|---|---|
| Cycle Life | 3000-5000 cycles | 800-1500 cycles |
| Thermal Stability | Excellent (safer) | Good (requires monitoring) |
| Optimal Charge Level | Can charge to 100% | Best at 80% max |
| Cost per Mile | Lower over fleet lifetime | Higher due to replacement |
| Insurance Impact | Potentially lower premiums | Standard premiums |
Key Takeaways
- E-bikes can double your delivery-per-hour rate in dense urban cores by bypassing traffic and parking issues.
- LFP battery chemistry offers up to 3x the lifespan of standard NMC batteries, drastically lowering your fleet’s total cost of ownership.
- A strict, UL 2849-certified charging protocol is non-negotiable for ensuring fleet safety, managing risk, and satisfying insurance requirements.
Solar Battery Storage vs. Grid Tie: Which Calculation Makes Sense for Suburban Homes?
While the title mentions suburban homes, the underlying question of energy strategy is highly relevant for any business running an electric fleet. A key advantage of e-bikes is their incredible energy efficiency. For example, electric cargo bikes consume up to 16 times less energy than electric vans to cover the same distance. This low energy demand opens up a powerful opportunity for businesses: generating your own power through on-site solar to achieve energy independence and cost stability.
For a commercial fleet, tying this solar generation to a battery storage system creates a compelling ROI. This setup allows your business to capture free solar energy during the day and store it to charge your e-bike fleet overnight, completely avoiding peak commercial electricity rates. This strategy transforms a volatile operational expense (grid electricity) into a fixed, predictable capital investment with a clear break-even point. It provides a powerful hedge against rising commercial energy prices.
The financial case is already being proven in the field. Business clients with fleets of around 50 bikes have reported achieving break-even on their solar and battery installations within just three years. This rapid ROI is driven by a combination of factors: arbitraging time-of-use electricity rates, taking advantage of government incentives for green energy, and the budget certainty that comes from having a fixed energy cost. For a fleet manager, this means your “fuel” cost can effectively drop to zero after the initial payback period, providing a massive long-term competitive advantage.
Stop guessing your ROI. Start calculating it with the right operational metrics. To assess your fleet’s specific potential, the next step is a detailed Total Cost of Ownership analysis tailored to your unique routes and delivery patterns.